So Far we have concerned ourselves with how the Plains Indians lived, or with their culture, but our subject would not be complete without a general idea of their anatomy and physical condition. According to the census of 1910 there resided within the United States 50,208 members of the tribes we have designated as Plains Indians. The number for each tribe, together with the extent of mixture, is shown in the table. Nearly all of the mixed-bloods are descend ants of white men and Indian women. We have no exact data as to the number of these Indians in Canada, but consider it to be less than 12,000. Since 1880 there seems to have been little change in the density of this population, though some tribes are now increasing. As to how the number of 1910 compares with the population of a century or more ago we can but guess, but there is no reason to believe that it ever exceeded 100,000.
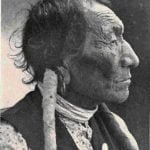
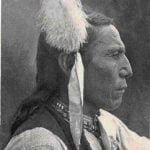
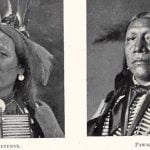
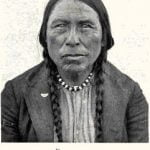
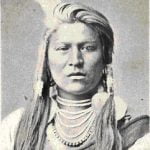
No careful study of the physical types for the Plains has been made. Our general impression of the tribal appearance is largely influenced by hair dress, costume, and posture, and it is difficult to dissociate these externals from somatic features. Yet, a brief scrutiny of casts of faces or photographs usually reveals tribal resemblances like those we see in families among our selves.
Population And Mixture Of Blood
| Tribe | Total Population | % Full-Blood | Tribe | Total Population | % Full-Blood |
| Teton Dakota | 14284 | 74.2 | Omaha | 1105 | 80.1 |
| Shoshoni | 3840 | 86.7 | Sioux (misc.) | 996 | 49.6 |
| Cheyenne | 3055 | 87.1 | Ponca | 875 | 52.7 |
| Sisseton Dakota | 2514 | 64.9 | |||
| Piegan | 2268 | 53.5 | Pawnee | 633 | 85.9 |
| Ute | 2240 | 94.1 | Hidatsa | 547 | 76.4 |
| Yankton Dakota | 2088 | 64.6 | Iowa | 547 | 24.2 |
| Crow | 1799 | 69.0 | Gros Ventre | 510 | 76.5 |
| Eastern Dakota | 1539 | 51.9 | Caddo | 452 | 74.3 |
| Arapaho | 1419 | 92.4 | Arikara | 444 | 83.8 |
| Osage | 1373 | 43.0 | Bannock | 413 | 78.2 |
| Yanktonai Dakota | 1357 | 84.3 | Oto | 332 | 63.6 |
| Nez Percé | 1259 | 77.0 | Wichita | 318 | 96.9 |
| Assiniboin | 1253 | 63.3 | Kansa | 238 | 29.8 |
| Comanche | 1171 | 62.9 | Mandan | 209 | 78.9 |
| Kiowa | 1126 | 72.6 | |||
| Average percentage of full-bloods 70.00 | Total population 50,208 | ||||
| Total full-blood population 35,000 | |||||
As the Indians of the Plains are but a subdivision of the same race this is about the only difference that should be expected. The color tone of the skin (a reddish chocolate) seems about the same throughout the area, though perhaps lighter with occasional leanings toward the yellow among some Blackfoot of the north ; yet to be exact, no color studies worthy of the name have been made. The hair is, like that of all Indians, uniformly black and straight. As to stature, they appear rather tall. The following average measurements have been reported.
| Millimeters | Inches | |
| Cheyenne | 1745 | 68.7 |
| Crow | 1732 | 68.1 |
| Arapaho | 1728 | 68.03 |
| Dakota | 1726 | 67.09 |
| Plains-Ojibway | 1723 | 67.8 |
| Blackfoot | 1715 | 67.5 |
| Kiowa | 1709 | 67.2 |
| Comanche | 1678 | 66.06 |
These are from the typical nomadic group of tribes as previously defined and with the exception of the Comanche are quite tall. As the figures above are averages, we must expect among the Cheyenne some very tall individuals. (Twenty percent of those measured, exceeded 1820 mm.).
On the west, the statures are less: again a tendency toward tall statures.
| Millimeters | Inches | |
| Nez Percé | 1697 | 66.8 |
| Ute | 1661 | 65.4 |
| Among the village group we note: | ||
| Millimeters | Inches | |
| Omaha | 1732 | 68.1 |
| Pawnee | 1713 | 67.4 |
| Arikara | 1690 | 66.5 |
So as compared, not only with other Indians, but with mankind as a whole, the Indians of the Plains are a tall people.
Looking at the faces of the various tribes, some general differences appear. Those of the Blackfoot, Plains-Cree, and Assiniboin seem rather rounded and delicate while those of the Dakota are longer and clear cut with strong lines, an eagle nose, and more prominent cheek bones. The Pawnee again have large, heavy, or massive faces. On none of these points, however, have investigations been made and it is an open question whether anything would be accomplished thereby other than the definition of minute differences. In historical times, at least, there was a great deal of intermarriage and visiting between these tribes which must have tended to level down somatic differences and which makes the successful determination of genetic relation ship quite improbable. As to head form, we find an index of about 80 for the Ute, Cree, Dakota, Blackfoot, Cheyenne, Arapaho, Pawnee, and a considerably higher value for the Comanche, Osage, Omaha, Wichita, and Kiowa.
Thus in general it appears that the Indians of the Plains are not anatomically distinct from those occupying some other parts of the continent. Yet, when closely considered they tend to form a group in distinction to the tribes of other areas. In the preceding chapters we observed that the tribes in the center of the Plains were more original in culture, where as those on the borders had assimilated may foreign traits. So in much the same way we find that the central tribes tend to be tall, while the marginal ones are shorter, like those of the neighboring culture areas. The same kind of differences appear in other characters. It is thus plain that the Indians of the Plains are some what distinct from other Indians, but these differences are small as compared with the differences between Indians and Europeans.

